
Infographics isn’t actually a new thing. Before it have been created by hand using simple ordinary tools such as paper, pencils, markers, and rulers. Today, in the era of technology, the process of infographics creating turned to be faster, easier and is available for everone.
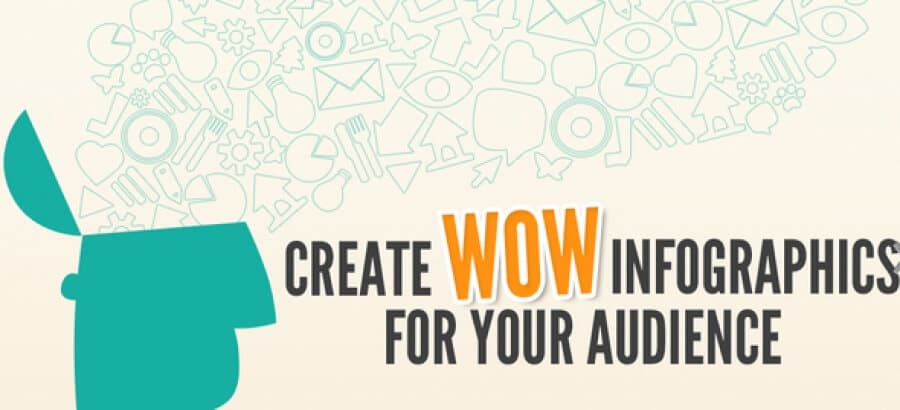
See image above
Frankly, Piktochart is one of the best looking tools in this list. This program is easy to use and offers a large number of choices in building, and editing your infographics. You can find categorized icons, design-driven charts, and interactive maps to utilize. One of the coolest aspects of this program is that they show how versatile infographics are for different projects. This means that whether you are creating for a classroom, office, website or social media setting- Piktochart gives you the heads up on how to use infographics effectively and to match your requirements. Also, there you can catch and enjoy the freedom to edit everything, always considering there the option to print or share it online. While reading user’s impressions the most common comment that I have found is that Piktochart makes them feel like designers. So, go ahead and be one of the designers.
Basically Inkscape is an open source vector graphics editor, with different opportunities similar to illustration. This application has one of the best visuals to create an infographic with no need of previous experiences. While you are about to start creating your own infographic one of the things you will find there are options like: drawing, shape tools, text tool, and tool for creating patterns. Then, after your create it but you realize you could do something better it is all okay because all you need is to try object manipulation and transform, raise and low operations, lock and/or hide individual row, and distributing commands. You can also mix and rearrange text, editing, shapes and objects. This is definitely a powerful tool even that you are just someone who needs to create eye-catching infographics!
This one is the right program especially if you want to design an infographic. It can work very well and satisfies your wishes as well as your needs. Once I checked their page I was really amazed because of so many different and attractive charts, maps, diagrams, tables etc. There is everything you could ever imagine for a special infographic, colorful and engaging. So, what you can find here? Easel is a simple tool which allows you to create and share impressive infographic. And you are the one to be impressed! Its website offers thousands of free graphic templates and design objects, after creating your favorite you can share it online for free too. Even that it is launches in 2012 it has exceeded over 300, 000 users. The categories listed with no doubt will suit your case and in the same time you will enjoy a beautiful visual view.
Based on my own previous experiences I would say that one of the most precious options that Infogram offers are charts. There are more than 30 various types of charts to choose from. For example tree maps, bubble charts, and simple pie charts. It brings out the best on your data. Its mission is to offer super-easy data visualization for everyone, and it is achieving its goal because the way to create, share and discover illustrated data is being very effective to be used by anyone.
Canva is free and easy to use. All necessary tools you can find in one single please, with no need of worry or experience. It is all filled with options, for whatever you are working for. Beautiful designs of infographics can be created by you in seconds. Except you can search for best graphics, photos and fonts you can also add from your own, and then use Canva’s drag and drop tool to manipulate. Every time that you need to turn your ideas into remarkable designs don not avoid its efficiency and simplicity. Knowing all the dimensions prepared for its users, you can focus your mind on creating and enjoying beautiful infographs in seconds.
Only in the last few years it has become easier to create infograhics online using simple and free tools too. Youth Time Magazine hopes that we were helpful at facilitating your way to wonderful and engaging infographics.
Support us!
All your donations will be used to pay the magazine’s journalists and to support the ongoing costs of maintaining the site.

Share this post


Interested in co-operating with us?
We are open to co-operation from writers and businesses alike. You can reach us on our email at [email protected]/[email protected] and we will get back to you as quick as we can.